Original URL: https://trevorsmale.github.io/techblog/post/pacu4/
Operating Running Systems ♺

Introduction
In this week’s Brown Bag session, we discussed the operation of running systems. This refers to when systems are live and possibly being accessed by users. During this time, we inspect settings, configurations, logs, and monitor running processes.
Purpose
- Identify anomalies 🔍
- Monitor users for incorrect usage 👥
- Detect nefarious behavior ⚠️
- Ensure processes have adequate resources ⚙️
- Check logs for faults or failures 📝
Class Notes
A project wherein a file name was not being recognized, but the uuid was. Once the uuid was placed in fstab, everything worked fine.
Grey Beard Wisdom 🧙♂️
- Make sure ports are open & server is on
- Rebuild Backups in a Test Environment to ensure integrity
- Write Stuff that can be supported by your team
- Whats the AI policy for the company?
Useful Tools/Resources/Commands:
Tripwire - Sourceforge Grubby - https://software.opensuse.org/package/grubby SANS.org srq trigger
Lab Notes 🧪
Server Checks
Warm Up
cd ~ # Change Directory to Home
ls # list
mkdir unit4 # Create a Directory named unit4
mkdir unit4/test/round6 # This fails 🙅, because the -p option is not invoked
mkdir -p unit4/test/round6 # This works because the Parent option -p is enables allowing for sub directories ✅
cd unit4 # Change to unit4 directory
man ps # View the manual for the ps command 👀
ps -ef # -e Display information about other users processes, including those without controlling terminals. -f Display the uid, pid, parent pid, recent CPU
ps -ef | grep -i root #PID 0, the process ID is zero
ps -ef | grep -i root | wc -L #this command could be helpful because within the root processes it finds the process with the longest line. This could help with finding resource heavy processes or identifying complex commands
top
Pre-Lab 🥪
rpm -qa | grep -i iostat #should find nothing 👍
dnf iostat #This automatically invoke an install response 🪄
Install package 'sysstat' to provide command 'iostat'? [N/y] y
Confirming that Sysstat is installed 👍
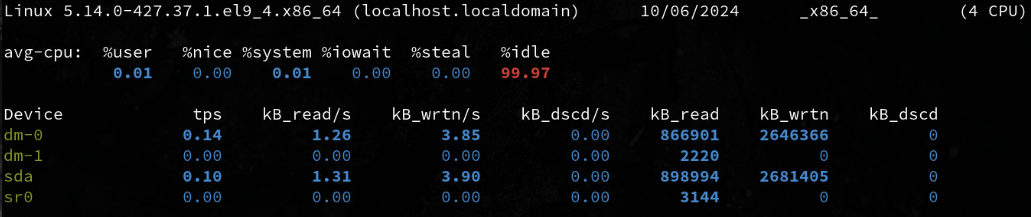
rpm –qa | grep –i sysstat # sysstat-12.5.4-8.el9_4.x86_64
dnf install sysstat # Unnessecary 👎
rpm –qa | grep –I sysstat # Didn't work 😐
rpm –qi sysstat # Didn't work 'unexpected token newline'
Confirming that Vim is installed 👍
rpm -qa | grep -i vim # vim-minimal-8.2.2637-20.el9_l.x86_64 ✅
Lab 🥼🧪
Gathering System release and kernel info 🌽
cat/etc/*release
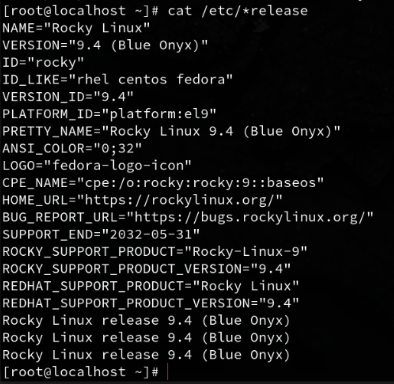
uname #Linux
uname -a #Show all
uname -r #release
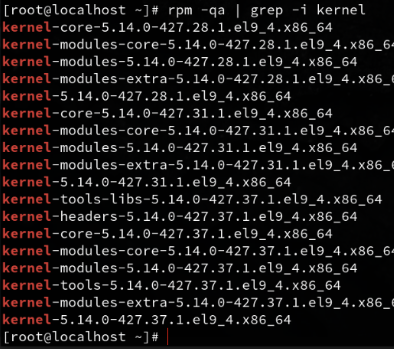
rpm -qa | grep -i kernel
Check the number of Disks 💾
fdisk -l #list partition tables
ls /dev/sd* #lists disks, with a wildcard at the end
pvs #physical volumes, Volume group and format
vgs #Volumes Groups
lvs #Logical Volumes
pvdisplay # More Comprehensive listing of Physical Volumes
vgdisplay # More Comprehensive listing of Volume Groups
lvdisplay # More Comprehensive listing of Logical Volumes
Check Disk Statistics 💾
iostat -d # Displays only device statistics
iostat -d 2 # Displays only device statistics in 2 second increments
iostat -d 2 5 # Displays only device statistics in 2 second increments for a total of 5 seconds
Check the amount of RAM 🍪
cat /proc/meminfo # a very comprehensive listing of memory info that spans multiple pages
free # Displays **Memory** and **Swap** Space usage
free -m # Diplays **Memory** usage in Mebibytes 1024 bytes MiB
🍼 I was today years old when I learned what a Mebibyte is 😄
Checking # of processors and processor info
cat /proc/cpuinfo
cat /proc/cpuinfo | grep proc | wc –l
iostat -c
iostat -c 2 # Runs CPU options in 2 second intervals.
iostat -c 2 5 # I had run this command before, in two second intervals for a total of 5 seconds
Check system uptime
uptime # 16:40 up 2 days, 17:38, 2 users, load averages: 2.81 2.46 2.30
man uptime # show how long system has been running for 1 min 2 min 15 mins
Check Recent Logins
last # vertical list of users ttys
last | more # more allows me to scroll through
w # Display detailed info about currently logged in users
who # Prints basic info about users currently logged in
whoami # Just lists your user name
Difference between w / who 🧐
| Command | Information Provided | Key Focus | Use Case |
|---|---|---|---|
who |
Basic info about logged-in users (username, terminal, login time, remote host) | Simple listing of users currently logged in | Quick check on who is logged in |
w |
Detailed info about logged-in users, system load, idle time, and active processes | Who is logged in and what they are doing, with system load info | System monitoring and activity tracking |
Check running processes and services
ps -aux | more # sending all listed processes to more
ps -ef | more # list every process
ps -ef | wc -l # counts the number of lines from a full format listing
Looking at Historical System Usage
sar - Collect, report, or save system activity information.
sar | more # check processing for the last day
sar -r | more # check all processes
Sar was not working, so I had to figure it out
sudo dnf install sysstat 👍
sudo systemctl enable --now sysstat ✅
sudo systemctl start sysstat ✅
sudo systemctl status sysstat ✅
sudo vim /etc/sysconfig/sysstat ✅
ENABLED="true" ✅
sudo systemctl restart sysstat ♺
sar # 👍 Works Now!
Ok back on course with sar
sar 2 # runs sar every 2 seconds
sar 2 5 # runs sar every 2 seconds for a total duration of 5 seconds
Check sar logs for previous daily usage
cd var/log/sa/
# ls
Interesting, sar logs are store in var/log/ who’d a thunk it
sar -f sa03 | head
Exploring Cron
Calm down snoop, this is job related 💩
There is a daemon running my cron, thank god I can check in on it 😈
ps -ef | grep -i cron
systemctl status crond
/var/spool/cron
ls -ld /etc/cron*
An Operations Bridge

A centralized platform that provides real-time visibility and control over an organization’s IT infrastructure and services.
— CIO WIKI1
Essentially 🧪
A unified view of operations, consolidating and correlating data from various sources.
General Purpose
- Streamline IT operations ⚡
- Improve service availability 📈
- Enhance incident response and resolution 🔍
General Features
Event Management 🔔
Collects and consolidates events and alerts from network devices, servers, applications, and security systems. Applies correlation and filtering to identify meaningful incidents and prioritize them based on service impact.
Performance Monitoring 🏎️
Monitors key performance indicators (KPIs) for infrastructure, applications, and services. Identifies performance bottlenecks, trends, and anomalies, enabling proactive optimization.
Incident Management 🚨
Captures, tracks, and escalates incidents. Facilitates collaboration and prioritization, ensuring timely resolution with historical insights and knowledge base integration for faster fixes.
Root Cause Analysis 🦷
Analyzes events, performance data, and logs to uncover the root causes of incidents. Uses data analytics to correlate related events and identify underlying issues affecting service availability.
Dashboards and Reporting 📊
Provides customizable dashboards and reports to visualize the health, performance, and availability of IT systems. Allows stakeholders to monitor key metrics, track service-level agreements (SLAs), and gain insights into overall system performance.
Automation and Orchestration ⚙️
Includes automation capabilities for routine IT tasks like system restarts, service provisioning, and configuration changes. Reduces manual effort, increases efficiency, and minimizes human errors.
Potential Challenges
Initial Setup and Configuration 🛠️
Can be complex and may require specialized expertise and significant manpower.
Integration with Multiple Systems 🧩
As the system grows in complexity, there’s an increased chance of failure and maintenance challenges.
Training and Skill Development 📚
Users may need training to effectively manage and operate the platform. Integrating disparate systems requires time and expertise.
Ongoing Maintenance and Updates 🔄
Frequent updates to data sources can disrupt connections, making regular maintenance essential. It’s not a turnkey solution.
Personal Take
The Term
The term Operations Bridge is relatively new to me. I would’ve called this a Unified Dashboard. The idea of bridging operations by consolidating and unifying data makes sense, but it’s a bit more complex than just a simple dashboard.
Outstanding Feature
The dashboard and reporting capabilities are the most critical. Seeing everything at a glance is invaluable. Other features can often be achieved using smaller tools like Cron jobs, Ansible, Bash, or Prometheus.
Complexity as a Weakness
The complexity is a major drawback. Constant tweaking seems inevitable in the ever-changing IT landscape. Large organizations with stable, long-term systems may benefit most, but the potential for cascading errors, like in Chernobyl, comes to mind when a single feedback loop causes widespread failures.
🚨 Incident Response Scenario 🚨
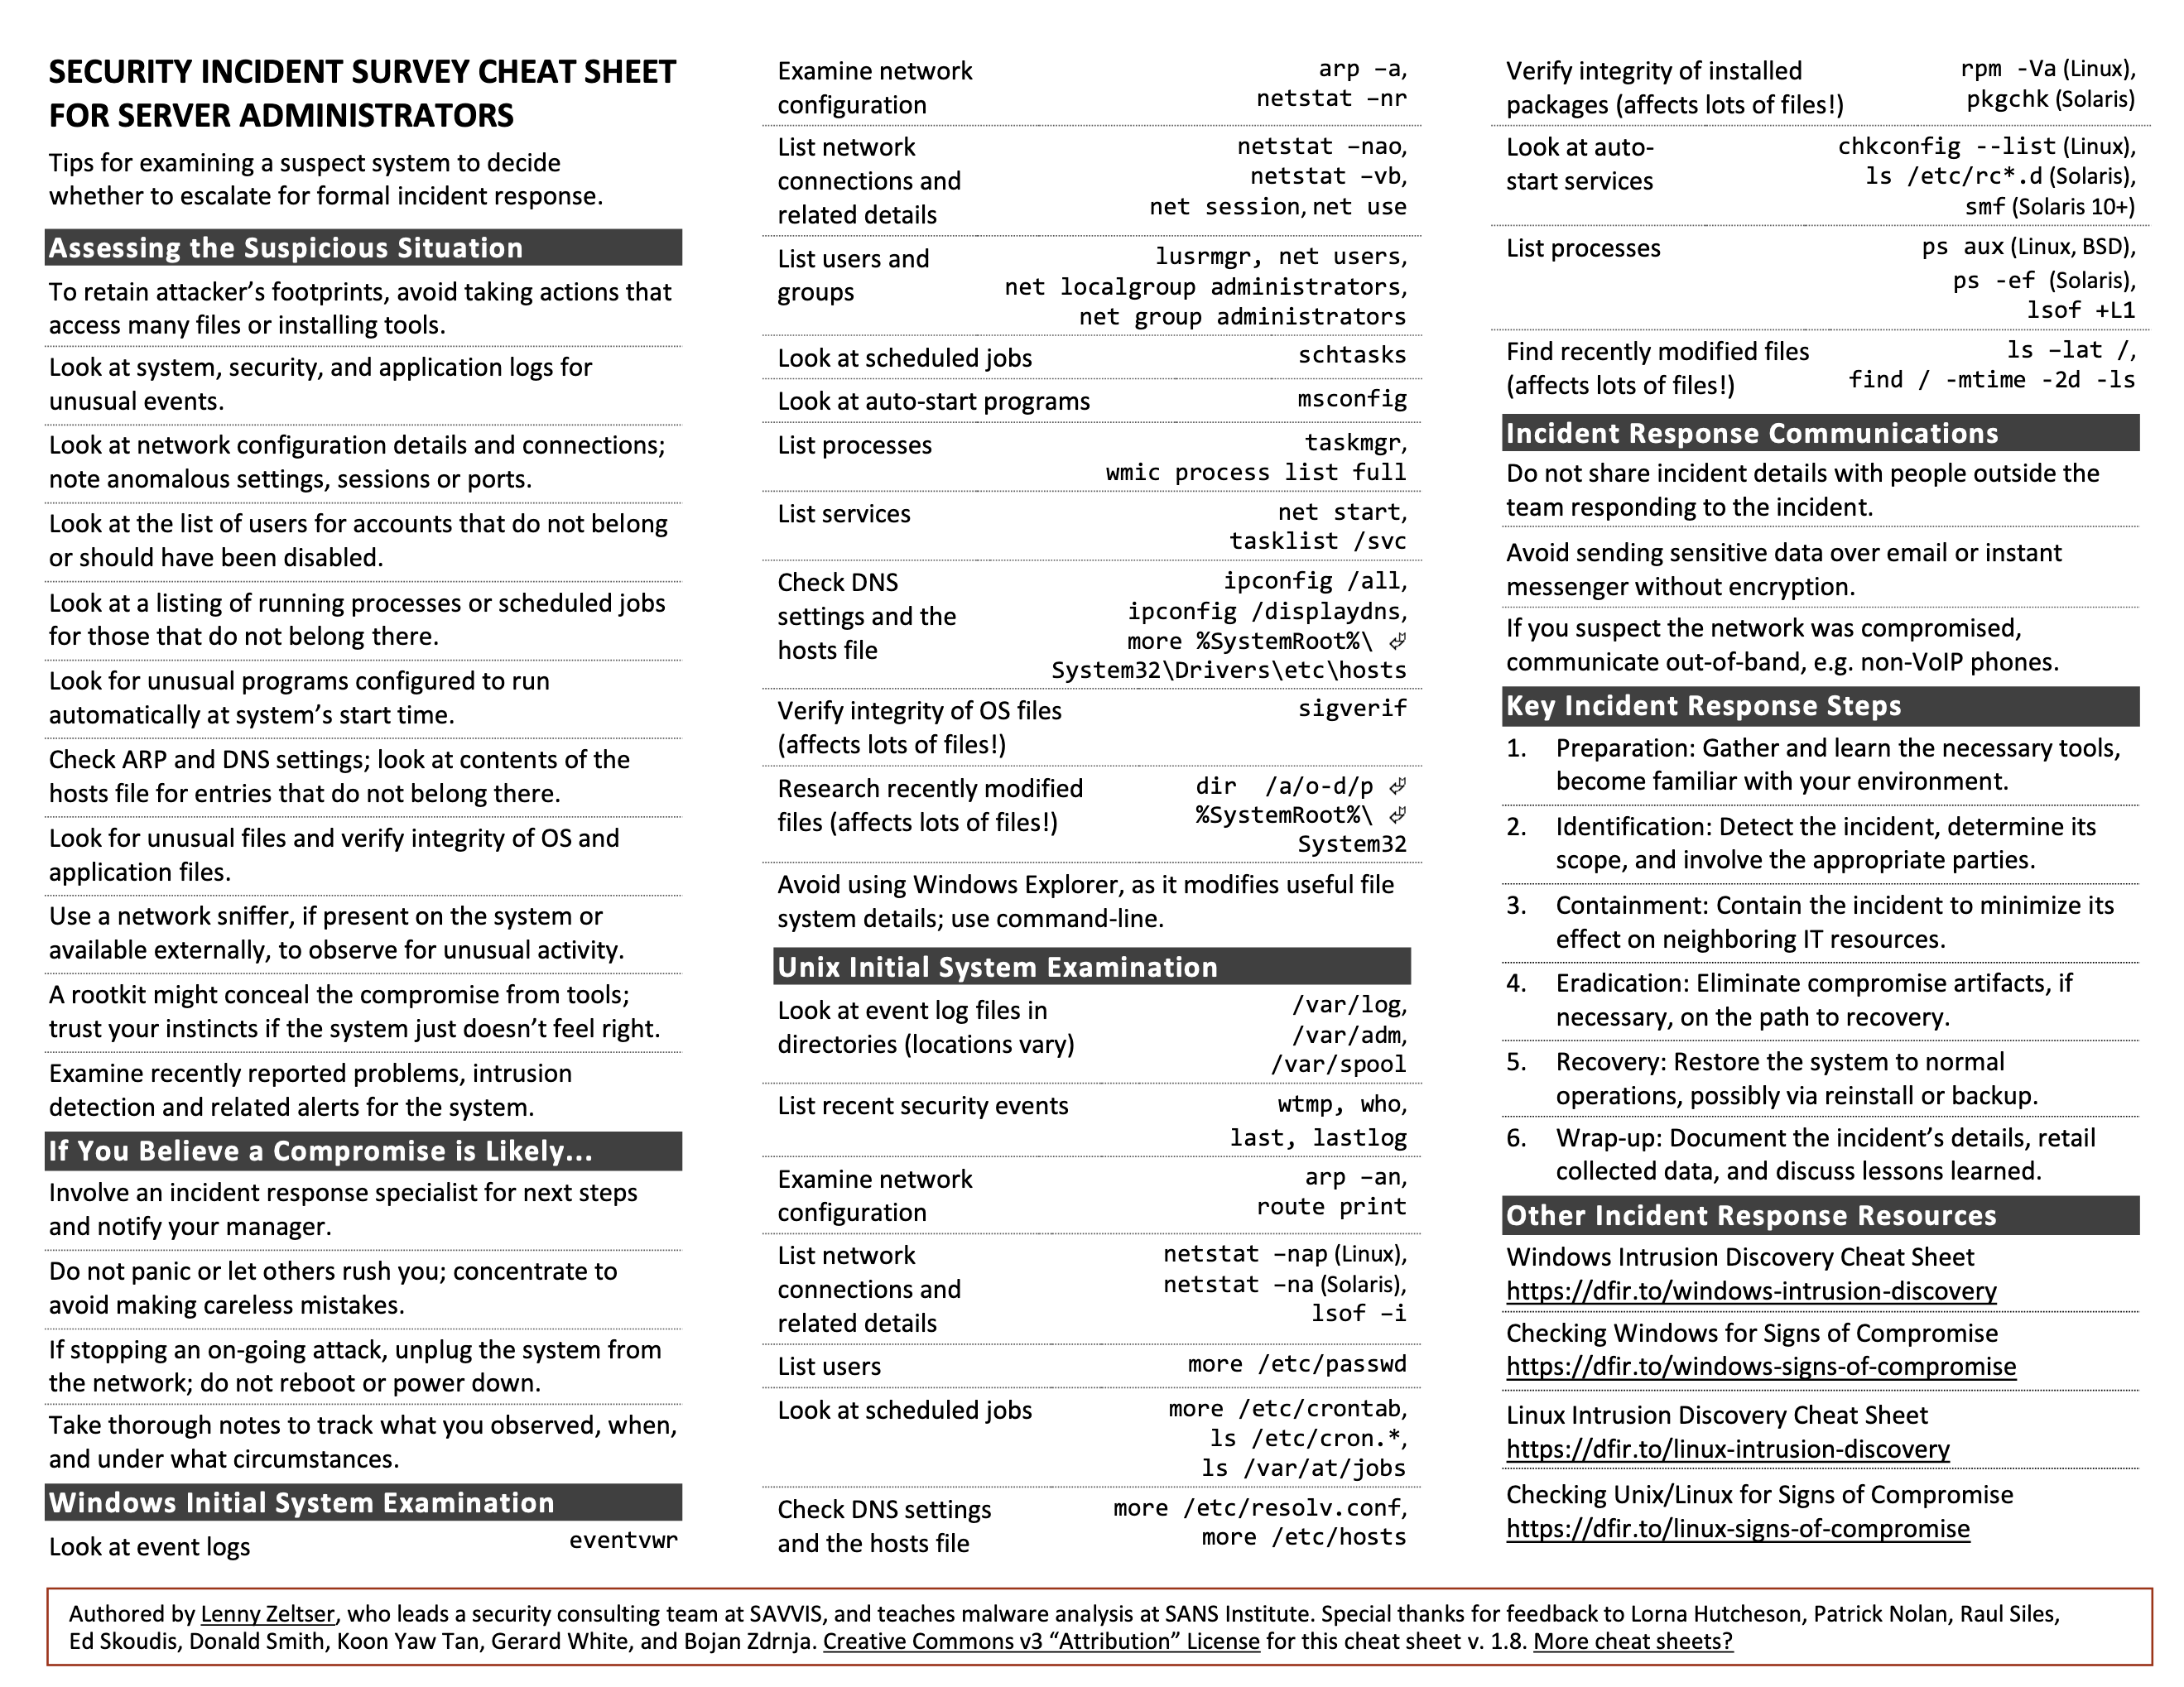
— Incident Response Cheatsheet2
Scenario Outline
Your team lacks documentation on how to check out a server during an incident.
Develop a procedure detailing what an operations person should do when a system is suspected of malfunctioning.
Key Points
- Undocumented server 🛠️
- Server malfunctioning 🚫
- Need for procedural diagnosis 🧑💻
Incident Response Cycle
- Detect
- Respond
- Mitigate
- Report
- Recover
- Remediate
- Lessons
Custom Incident Procedure
1. Detect / Observe
- Check process logs
- Check security logs
- Check application logs
2. Respond
Snapshot 📸
If possible, take a snapshot of the current system. Treat it like a crime scene—nothing should be disturbed or altered. This snapshot is crucial for forensic analysis of the system’s state.
Triage 🩺
Scan the system for symptoms. Determine if it’s a security incident or a bug.
Examine 🩻
- Network configuration
- DNS settings
- Hosts file
- Autostart processes
- Scheduled jobs
List 📝
- Active network connections
- System users
- Running processes
- Recently modified files
Verify ✔
- Integrity of installed packages
3. Mitigate
After triaging, identify the nature of the issue. If it’s a:
- Security Incident 🚨 — Follow the [Crisis Management Procedure]3
- Bug 🪲 — Proceed with the steps below
4. Report / Declare 📣
Inform the team and supervisors that the incident has been triaged, diagnosed, documented, and mitigated.
5. Recover 🛠️
Develop or follow a recovery plan to restore the system to normal operation. Document the recovery steps for future reference.
6. Remediate / Repair 🛠️
Fix the issue based on its nature. This could involve:
- Reconfiguration
- Patching
- Blocking/Banning
- Restoration
- Allocating new resources
- Turning it off and on 😁
7. Document / Lessons 📝
Write a report detailing the problem, its cause, and the steps taken to resolve it. Include a lessons learned section to improve future responses.
8. Bask ☕️
Once resolved, lean back, nod in satisfaction, and enjoy your coffee. Every resolution deserves a small moment of celebration.
The Battle Drill ⚔️ 4
A Battle Drill is a standard operating procedure used in infantry training. It’s based on common scenarios that require rapid, collective action. By practicing battle drills, a team can react quickly and efficiently to dangerous situations without the need for complex decision-making.
Battle drills prepare infantry for swift, organized, and aggressive responses to high-stress situations such as explosions, direct fire, flashing lights, chemical exposure, or sudden assaults.
Battle Drills are for those moments when everything is going wrong and you need a reactionary response. — Scott Champine
⏱️ Reaction time and mental readiness are key to success.
Application to Operational Incidents 🛠️
The principles behind battle drills can easily be applied to system operations, where rapid group responses to incidents are critical.
Documentation 📝
- Procedures must be well-documented and easy to understand for all possible scenarios.
Clear Objectives 🎯
- Leadership communicates simple and clear objectives to the team for each scenario.
Drilling / Testing 🧑💻
- Teams practice scenarios together, following the documented procedure and maintaining effective communication.
Known Procedure 👥
- Through review and practice, everyone knows their role and objectives in the group, ensuring a unified response in any scenario.
The Importance of Drilling 🔄
In real incidents, there’s often no time to plan a response. For regular operations, we have the luxury of preparation and research, but in high-stress, mission-critical situations, the pressure can become overwhelming, potentially leading to paralysis. Preparedness through practice is essential.
Knowing Your Tools 🧰
In the infantry, this means knowing how to load, reload, field-strip, and fire a weapon, or apply first aid using a trauma kit to save a fellow soldier.
These concepts are equally valuable in system operations. Knowing how to run basic commands, troubleshoot issues, break down problems, and write scripts all fall under knowing your tools. Just as a soldier must be able to handle their equipment with their eyes closed, an operator must be fluent in the commands, tools, and procedures they rely on daily. This level of expertise comes from memorizing commands, knowing paths, and practicing scripting.
Detection
Response
Mitigation
Reporting
Recovery
Remediation
Lessons Learned
After action review
Operations Bridge
Reflecting upon Unit #4
- What questions do you still have about this week?
Note-Taking Improvements
A few months before this course, I realized that to deepen my understanding of systems, I needed to take extensive notes I could easily refer back to. After doing thorough research on different note-taking systems, I concluded that LogSeq5 was the best fit for my needs.
I chose LogSeq5 because:
- It’s open source
- Local-first
- Supports tags
- Uses Markdown
- Works across all platforms
Since adopting LogSeq, I’ve taken an immense amount of notes. I’ve also created a lot of cheat sheets and references, thanks to LLMs and various GitHub repositories. Let’s just say my note-taking game has been strong.
When this course started, I knew that note-taking would be a big component. Most of my notes are private since I prefer to write candidly, sometimes using strong language. To share more polished, public-friendly notes, I created this HUGO blog. I’m a stickler for clean layouts, typesetting, and readability, so filling out pre-formatted documents isn’t my style.
ProLUG Links ⛓️
Discord: https://discord.com/invite/m6VPPD9usw Youtube: https://www.youtube.com/@het_tanis8213 Twitch: https://www.twitch.tv/het_tanis ProLUG Book: https://leanpub.com/theprolugbigbookoflabs KillerCoda: https://killercoda.com/het-tanis