Original URL: https://trevorsmale.github.io/techblog/post/pacu3/
Storage & Logical Volume Management 🧠💾
Intro
Ok, Week 3 / Unit 3. This week we are working on Logical Volume Management (LVM) and RAID. Fortunately I was able to listen to the entire lecture and read most of the chats which is always helpful.
Lab Notes 🧪
Warmup
Redirects ✉️
cd ~ # Change Directory to Home
mkdir lvm_lab # Create a Directory called lvm_lab
cd lvm_lab # Change location into the lvm_lab directory
touch somefile # create an empty file called somefile
echo "this is a string of text" > somefile # This sends the output of echo into the file
cat somefile # concatenates and displays what is in the file
echo "this is a sting of text" > somefile # Overwrites the line with the same text
echo "this is a sting of text" > somefile
echo "this is a sting of text" > somefile
cat somefile # We are left with one line of text after repeating this action because this
action overwrites.
echo "This is a string of text" >> somefile # The double arrow is redirect append
echo "This is a string of text" >> somefile # this adds a second line
echo "This is a string of text" >> somefile # this adds a third line
cat somefile # The concatenated output would be 3 line of "This is a string of text"
echo "this is our other test text" >> somefile
echo "this is our other test text" >> somefile
echo "this is our other test text" >> somefile
cat somefile | nl # This adds numbering to each line in the file
cat somefile | nl | grep test # This does nothing as there is no text within the file that
contains the string nothing
cat somefile | grep test | nl # Also nothing
cat somefile | nl | other # Gives us our last 3 lines and associated line number
always | nl | before your grep
Lab 🥼🧪
Disk Speed Tests ⏱️
This is on my own virtual machine, so figuring out the unique commands took a bit of extra work.
lsblk /dev/sda2
p #print to see partitions
d #delete partitions or information
w #Write out the changes to the disk.
Write tests 💾
saving off write data – rename /tmp/file each time
Checking /dev/sda2 for a filesystem
blkid /dev/sda2 👍
If no filesystem, make one
mkfs.ext4 /dev/sda2
mkdir space
mount /dev/xvda space ?
Write Speed Test 💾🏎️
for i in 'seq 1 10';do time dd if=/dev/zero of=/space/testfile$ bs=1024k count=1000 | tee -a /tmp/speedtest1basiclvm
Write Test Result
real 0m0.003s
user 0m0.000s
sys 0m0.002s
Read Test 👓💾
for i in 'seq 1 10';do time dd if=/space/testfile$i of=/dev/null;done
Read Test Result
real 0m0.001s
user 0m0.001s
sys 0m0.001s
Cleanup 🧹
for i in 'seq 1 10'; do rm -rf/space/testfile$i;done
LVM 🧠💾
start in root (#); cd /root
Check physical volumes on your server (my output may vary)
[root@rocky1 ~]#fdisk -l | grep -i sda
output:
Disk /dev/sda: 32 GiB, 34359738368 bytes, 67108864 sectors
/dev/sda1 2048 2099199 2097152 1G 83 Linux
/dev/sda2 2099200 67108863 65009664 31G 8e Linux LVM
Basic LVM listings
pvs
output:
PV VG Fmt Attr PSize PFree
/dev/sda2 rl_localhost-live lvm2 a-- <31.00g 0
vgs
output:
VG #PV #LV #SN Attr VSize VFree
rl_localhost-live 1 2 0 wz--n- <31.00g 0
output:
lvs
LV VG Attr LSize Pool Origin Data% Meta% Move Log Cpy%Sync Convert
root rL_localhost-live -wi-ao---- 27.79g
swap rL_localhost-live -wi-ao---- 3.20g
pvdisplay (Needs SUDO or Root)
output:
PV Name /dev/sda2
VG Name rl_localhost-live
PV Size <31.00 GiB / not usable 3.00 MiB
Allocatable yes (but full)
PE 4.00 MiB
Total PE 7935
Free PE 0
Allocated PE 7935
PV UUID gMVNd5-peB1-uUX6-Rw28-4Ncb-mi1b-rDJR38
-
PV Name:
/dev/sda2- This is the physical volume (PV) name, which indicates the device or partition that has been initialized as a physical volume for use in LVM (Logical Volume Manager).
-
VG Name:
rl_localhost-live- This is the volume group (VG) name to which this physical volume belongs. A volume group is a collection of physical volumes that create a pool of storage space from which logical volumes (LVs) are allocated.
-
PV Size:
<31.00 GiB / not usable 3.00 MiB- The size of the physical volume is 31.00 GiB, but 3.00 MiB is not usable, likely due to overhead or alignment issues within the physical volume.
-
Allocatable:
yes (but full)- This indicates whether the physical volume is available for allocation into logical volumes. It is set to “yes,” but the “full” remark means that all available physical extents (PEs) are already allocated.
-
PE Size:
4.00 MiB- This shows the size of a physical extent (PE), which is the smallest chunk of data that LVM manages. In this case, each PE is 4.00 MiB.
-
Total PE:
7935- The total number of physical extents on this physical volume. This is calculated based on the size of the physical volume and the size of each PE.
-
Free PE:
0- This shows the number of free physical extents on the physical volume. In this case, there are no free extents left, meaning all available space has been allocated.
-
Allocated PE:
7935- The number of allocated physical extents, which are being used by logical volumes. Since all available extents are allocated, this number matches the total number of PEs.
-
PV UUID:
gMVNd5-peB1-uUX6-Rw28-4Ncb-mi1b-rDJR38- The unique identifier for this physical volume, which is used internally by LVM to track physical volumes across different systems or reboots.
vgdisplay: needs sudo
example output:
 --- Volume group ---
VG Name vg_data
System ID
Format lvm2
VG Status resizable
MAX LV 0
Cur LV 2
Open LV 2
Max PV 0
Cur PV 2
Act PV 2
VG Size 99.99 GiB
PE Size 4.00 MiB
Total PE 25599
Alloc PE / Size 12800 / 50.00 GiB
Free PE / Size 12799 / 49.99 GiB
VG UUID hFwi0D-GTlv-NFjp-O2he-x8Yw-kfIa-c3QqX6
lvdisplay: needs sudo
example output:
 --- Logical volume ---
LV Path /dev/vg_data/lv_backup
LV Name lv_backup
VG Name vg_data
LV UUID B1q8Iq-0tWz-Fk0P-xwQ7-0T5T-QC3c-XcK5T1
LV Write Access read/write
LV Creation host, time hostname, 2024-10-08 12:00:00 +0000
LV Status available
# open 1
LV Size 50.00 GiB
Current LE 12800
Segments 1
Allocation inherit
Read ahead sectors auto
- currently set to 256
Block device 253:2
Creating & Carving LVM
A little struggle 😣
So I ran into several hurdles when putting this into practice with Proxmox.
📍 Since I was using Proxmox the storage was already an LVM on account of it being a virtualized disk Solution: I created a second storage volume in addition to sda, sdb was emulated as an SSD and RAW storage. Once this was set up I was able to initialize the process.
📍 The demonstration lab suggested using /dev/xvd$disk the ‘x’ relates to xcp-ng, a virtualization technology that differs from mine. I am using KVM and VirtIO on Proxmox so the naming convention would differ. so vdb would be a naming convention akin to this system.
Ultimately, once I created this RAW SSD emulated storage I was able to move on.
The steps
1. Provisioning the Physical Volume ✅
sudo pvcreate /dev/sdb
Output: Physical volume “/dev/sdb” successfully created.
Confirmed with: lsblk
2. Provisioning the Volume Group ✅
sudo vgcreate examplegroup /dev/sdb
Output: Volume group “examplegroup” successfully created
Confirmed with: vgdisplay
3. Provisioning the actual Logical Volume ✅
sudo lvcreate -L 1G -n lv1 examplegroup
Logical volume "lv1" created.
Confirmed with: lvdisplay
4. Formatting a Logical Volume with a FS 💾 ✅
mkfs.ext4 /dev/mapper/lv1
 mke2fs 1.45.6 (20-Mar-2020)
Creating filesystem with 262144 4k blocks and 65536 inodes
filesystem UUID: a1b2c3d4-e5f6-789a-bcde-123456789abc
Superblock backups stored on blocks:
32768, 98304
Allocating group tables: done
Writing inode tables: done
Creating journal (8192 blocks): done
Writing superblocks and filesystem accounting information: done
Checking remaining VG Space
Broadly:
the VGS command provides a summary of all Volume Groups and includes information about the free space.
Looks like this:
 VG #PV #LV #SN Attr VSize VFree
vg_data 2 3 0 wz--n- 199.99g 49.99g
More Specifically:
The vgdisplay command will show this info as it pertains to a particular pv 👍
Ultimately
Thanks to putting our heads together in a studygroup, I was able to get through the completed process several times. I ended carving of a Volume Group into Logical Volumes. Some of which were formatted in Ext4 and some were formatted to XFS using MKFS. 😁
The process was a little bit long with many tangential learning, ultimately I think this experience has deeply ingrained the process in my psyche, pushing out childhood memories of finger painting.
Fstab
I would like to return to Fstab and learn more about it. I ran into some issues mounting LVM’s with Fstab
LVS
Logical Volume Summary provides a summary as the name implies of all logical volumes present in the system. I wish I had known this command earlier as I was using the other commands listed above 😄
Example output:
 LV VG Attr LSize Pool Origin Data% Meta% Move Log Cpy%Sync Convert
lv_backup vg_data -wi-a----- 50.00g
lv_home vg_data -wi-ao---- 20.00g
lv_root vg_system -wi-ao---- 30.00g
RAID 💾💾💾
RAID stands for Redundant Array of Independent Disks, more on that below.
Raw notes:
Created a proxmox vm with rocky 9.4 minimal with 3 x raw ssd emulated disks
MDADM
Lecture thoughts 🪩
Everything ‘is’ a file after all
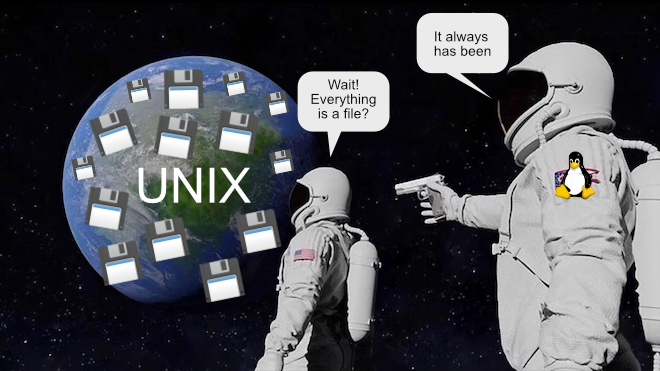
this past Saturday. During that lecture I had a major awakening in regards to how unix works. I have heard the ’everything is a file’ mantra on several occasions. However, sometimes hearing is not fully understanding. My moment of understanding came when we checked running processes and opened one as a file. I knew that everything under the hood was a file, but ephemeral things like processes were not part of the picture. That truly blew my mind 🤯
UUID’s go beyond a block storage device
It turns out that logical volumes are assigned UUIDs. UUIDs are unique strings that can be used to reference or link reliably to storage device. So logical volumes attain the same respect as physical volume.
if I were to run
bash blkid
or
bash lvddisplay
one would see a string like this:
f4d12857-93c3-4d6f-91e5-bb379f02e1d1
More on this later, I went down a rabbit hole. 🐇
Logical Volumes 🧠💼
Logical Volumes (LVs) offer a flexible way to manage disk storage in Linux. With LVs, users can create, resize, and move storage volumes without being limited by the physical layout of the disks. The Logical Volume Manager (LVM) abstracts the underlying physical storage, making it easier to manage disk space, support snapshots, and resize volumes as needed.
The Layered Structure 🍰
The structure of LVM involves multiple layers:
- Physical Volumes (PV): These are the actual physical storage devices, like SSDs or HDDs. A Physical Volume can either be part of a Volume Group or encompass an entire Volume Group.
- Volume Groups (VG): VGs are containers that hold one or more Logical Volumes. A Volume Group can span across multiple Physical Volumes, providing a flexible pool of storage.
- Logical Volumes (LV): LVs are sections of a Volume Group that serve as the actual storage units. A Volume Group can contain many Logical Volumes of different sizes.
- File Systems: Finally, file systems are placed on the Logical Volumes to store data.
The table below illustrates how a Volume Group (VG) can host several Logical Volumes (LVs) of varying sizes. Each Logical Volume is assigned a unique identifier (UUID), and snapshots are also given their own UUIDs.
| VG | LV | FS | Size | UUID Short | Snapshot | Snapshot UUID Short |
|---|---|---|---|---|---|---|
| vg_data | lv_root | XFS | 50 GB | f4d1-91e5-bb37 | None | N/A |
| vg_data | lv_home | XFS | 100 GB | a123-c567-8901 | snap_home | abcd-ef56-7890 |
| vg_data | lv_var | ext4 | 20 GB | c9d8-89e0-f9a1 | None | N/A |
| vg_data | lv_backup | ext4 | 150 GB | f129-bc97-f134 | snap_backup | f7d8-a67e-f765 |
| vg_data | lv_logs | XFS | 10 GB | e123-9abc-e1d4 | None | N/A |
| vg_storage | lv_media | ext4 | 200 GB | bc97-bc9e-5612 | snap_media | d98f-9e67-1cd2 |
I understand that this course focuses on the two most popular and reliable file systems, as these are the ones most commonly encountered in enterprise environments. However, I’ve noticed that BTRFs is starting to gain traction. I’ve listened to several talks and read extensively about its features and potential.
Some limitations apply to the status quo
Both ext4 and XFS subvolumes can handle a lot of scenarios. This includes online resizing. This is when the size of an LVM must be increased while actively in use (Online). However, for both of these filesystems, online resizing can only grow and LVM and not shrink. Additionally snapshots must be managed on a per LV basis, not a huge issue with the advent of automation tools.
RAID
Intro
RAID stands for Redundant Array of Independent Disks (originally Redundant Array of Inexpensive Disks). It is a data storage technology that combines multiple physical disk drives into a single logical unit to improve performance, increase capacity, or provide redundancy to protect data against drive failures.
How it differs from LVM
- RAID is primarily for redundancy and performance.
- RAID works at a block level across discs.
- So it is sometimes used to create a high capacity pool.
Multiple configurations
- There are configurations for differing degrees of performance
- There are configurations for different levels of redundancy
Comparison Table
| RAID Level | Description | Performance | Redundancy |
|---|---|---|---|
| RAID 0 | Data striping without parity or mirroring. | High (fast read/write speeds) | None (no redundancy) |
| RAID 1 | Mirroring of data across two or more disks. | Moderate (read speed improves, write speed similar to single disk) | High (data is mirrored) |
| RAID 5 | Block-level striping with distributed parity. | Moderate (improved read speeds, slower writes due to parity calculation) | Moderate (can tolerate 1 disk failure) |
| RAID 6 | Block-level striping with dual parity. | Moderate (similar to RAID 5, but slower writes) | High (can tolerate 2 disk failures) |
| RAID 10 | Striping across mirrored sets (combines RAID 1 and RAID 0). | High (fast read/write due to striping and redundancy) | High (can tolerate multiple disk failures depending on which disks fail) |
| RAID 50 | RAID 5 arrays striped (combines RAID 5 and RAID 0). | High (fast read speeds, but slower writes) | Moderate (can tolerate up to 1 disk failure in each RAID 5 array) |
| RAID 60 | RAID 6 arrays striped (combines RAID 6 and RAID 0). | High (fast reads, slower writes due to dual parity) | Very High (can tolerate up to 2 disk failures in each RAID 6 array) |
| RAID 1+0 | Nested RAID 1 over RAID 0 (mirroring across striped sets). | High (similar to RAID 10) | High (similar to RAID 10) |
Software & Hardware Raid
- Software RAID is when the host Operating System maintains the linking and syncing.
- Hardware RAID is when a dedicated device does this. For example a PCI raid controller.

A software RAID is:
is running as a general task through the CPU. With multi-core/thread processors and more robust process handling, software RAID is more reliable than in the past. Advantages:
- Portable 🦶
- Flexible 🧘
- Cost Effective 💰
Hardware RAID is:
Application specific hardware like a RAID Controller always has the potential to be more performant and reliable. But this is mfg. dependent, the good ones tend to be expensive (such as life) 💸
- Performant* 🏎️
- Reliable* ⏳
Other Filesystem research/writing
Btrfs
I wrote an entire separate article about B-Tree FileSystem as I find it interesting Link to Btrfs article
Linux Filesystem Comparison
I find file-systems really interesting. Recently I made a huge note comparing the major FileSystems. Link to FileSystems note/article
Linux Filesystem Timeline
This timeline may help illuminate how filesystems incrementally improve over time.
| Year | Milestone |
|---|---|
| 1993 | ext2 filesystem development begins. |
| 1994 | ext2 released with Linux Kernel 1.0. |
| 1994 | XFS first developed by SGI for IRIX. |
| 2001 | ext3 released, introducing journaling. |
| 2001 | XFS ported to Linux. |
| 2006 | Development of ext4 begins to extend the capabilities of ext3. |
| 2007 | BTRFs development announced by Oracle. |
| 2008 | ext4 marked as stable in Linux Kernel 2.6.28. |
| 2009 | BTRFs included in Linux Kernel 2.6.29 as an experimental filesystem. |
| 2009 | XFS officially included in Linux Kernel 2.6.36. |
| 2010 | ext4 becomes the default filesystem for many Linux distributions, including Ubuntu and Fedora. |
| 2012 | BTRFs adopted by SUSE Linux Enterprise Server. |
| 2014 | XFS becomes the default filesystem in RHEL 7. |
| 2014 | Fedora starts offering BTRFs as an option. |
| 2020 | Fedora 33 makes BTRFs the default filesystem. |
Crisis Management 🔥🧯
Intro
I read a chapter from googles security handbook focused on responding to a security incident. This chapter covers a wide range of information including common mistakes, templates etcc… Scott has asked us to pull keywords that may help us better triage an incident. I decided to extend this to creating an incident response checklist for future reference. This order of the list slightly differs from that of the article, yet I think it summarizes the chapter well.
Overview 🔍
Effective crisis management requires taking command and maintaining control of an incident. The outcome of a security incident largely depends on how well your organization prepares and responds, a process referred to as incident response (IR) capability.
Transparency 🔮
Transparency is key in managing incidents, particularly in light of regulations such as GDPR and service contracts. Customers are continually pushing the boundaries for how quickly investigations must begin, progress, and be resolved. Organizations are often expected to respond to potential security problems within 24 hours or less.
As the saying goes: “There are only two types of companies: those that know they’ve been compromised, and those that don’t know.”
Steps of Crisis Management 🪜
1. Triage 🥼
- The First Step: Don’t Panic! Not every incident is a crisis.
- Differentiate between compromises and bugs.
- Make educated and informed assumptions about the severity and potential consequences of the incident.
- What data might be accessible to someone on the compromised system?
- What trust relationships does the potentially compromised system have with other systems?
- Are there compensating controls that an attacker would also have to penetrate?
- Does the attack seem to be commodity opportunistic malware?
2. Manage 🧠
-
Establish Your Incident Team:
- Management Liaison: Coordinate between the technical team and upper management.
- Incident Commander (IC): Ultimately responsible for ensuring that rules around confidentiality are set, communicated, and followed.
- Operations Coordinator (OC): Coordinate the technical side of the incident response.
- Legal Lead: Ensure the response complies with legal obligations.
- Communications Lead: Ensure internal and external communications are clear and effective.
Guidelines for Management:
- Maintain a clear line of command.
- Designate clearly defined roles.
- Keep a working record of debugging and mitigation steps as you go.
- Declare incidents early and often.
3. Declare 📣
- Declare incidents as soon as they are recognized to ensure early containment and response.
4. Communicate ☎️
- Avoid Misunderstandings: Ensure that all parties are aligned on the severity and impact of the incident.
- Avoid Hedging: Be clear and concise in communication, avoiding ambiguity.
- Meetings: Hold regular update meetings to ensure that the team and stakeholders are aware of the incident’s progress and next steps.
5. Operational Security (OpSec) 🥷
- OpSec refers to the practice of keeping your response activities confidential.
- Use secure lines of communication.
- Avoid interacting directly with affected networks or components.
- Lock down affected accounts immediately.
- Shut down compromised systems to prevent further damage.
- Use different credentials when interacting with compromised systems.
- Ensure the right people are informed with the correct level of detail about the incident.
6. Investigate 🕵
- Follow the OODA Loop: Observe, Orient, Decide, and Act.
- Forensic Imaging: Capture system images for later analysis.
- Memory Imaging: Capture the contents of system memory.
- File Carving: Extract useful files from data storage.
- Log Analysis: Analyze system logs to identify suspicious activity.
- Malware Analysis: Dissect malware to understand its function.
- Sharding the Investigation: Divide the investigation into manageable parts.
- Parallelize the Incident: Have different teams working on different aspects of the investigation simultaneously.
7. Handover ⛓️
- Properly hand over any remaining tasks or investigations to ensure nothing is overlooked as the incident winds down.
8. Remediate 🛠️
- Fix vulnerabilities and mitigate damage to prevent future incidents. Implement long-term security measures.
9. Close 📒
- Close the incident formally. Review what went well, what could have been better, and document the lessons learned for future incidents.
High Availability ⚓️
refers to the design and implementation of systems, services, or applications to minimize downtime and ensure continuous operation. The goal of high availability is to ensure that a system is accessible and operational for the maximum possible amount of time.
Key Terms in HA 🔑
1. Uptime & Downtime ↕️
- Uptime: The period during which a system is fully operational and accessible to users.
- Downtime: The period during which the system is unavailable or not functioning as expected. HA systems aim to minimize downtime as much as possible.
2. Redundancy 👯
Redundancy refers to duplicating critical components or functions of a system to increase reliability. In HA systems, components like servers, databases, or networks are replicated so that if one fails, another can take over seamlessly.
- Active-Active Redundancy: Multiple systems work simultaneously, and if one fails, the others continue without interruption.
- Active-Passive Redundancy: A primary system works actively, while a backup system remains idle until a failure occurs.
3. Failover 🛤️🛤️🛤️
Failover is the process of switching to a standby or backup system when the primary system fails. In HA setups, failover is often automatic to minimize disruption. Failback refers to switching back to the primary system after recovery.
4. Load Balancing ⚖️
Load balancing distributes network or application traffic across multiple servers to ensure that no single server becomes overwhelmed. It enhances both performance and availability by balancing the load and rerouting traffic in case of server failures.
5. Elastic Scaling 🎋
Elastic scaling is the ability to automatically adjust resource capacity (compute, memory, etc.) based on workload demand. This is crucial for HA, as it prevents resource exhaustion during peak loads and reduces costs during low-demand periods.
- Horizontal Scaling (Scaling Out): Adding more instances/servers to distribute load.
- Vertical Scaling (Scaling Up): Increasing the resources of a single instance.
- Auto-scaling: Automatic scaling based on real-time metrics.
In Kubernetes, elastic scaling is managed through Horizontal Pod Autoscalers (HPA), which automatically scale the number of pods in a deployment based on observed CPU utilization or other metrics. In HA systems using Kubernetes, autoscaling ensures that the right amount of resources are always allocated based on demand, contributing to both high performance and availability.
6. Fault Tolerance 🤦♂️😅
Fault tolerance refers to the system’s ability to continue operating correctly even when one or more components fail. Fault-tolerant systems detect, isolate, and handle faults without causing downtime.
7. Cluster 🧑🍳🧑🍳🧑🍳🧑🍳
A cluster is a group of servers or nodes working together as a single system to provide HA. Clustering ensures that if one node in the cluster fails, another node takes over its tasks, maintaining service availability.
In Kubernetes, a cluster consists of a set of worker machines, called nodes, that run containerized applications. Kubernetes ensures high availability by distributing workloads across multiple nodes and automatically replacing failed nodes or restarting containers.
In Warewulf, a cluster provisioning tool, high availability is addressed by enabling systems to quickly re-deploy compute nodes. Warewulf helps manage HA in high-performance computing (HPC) environments by ensuring compute nodes are readily available for workloads in case of node failure or maintenance.
8. Replication 💾💾💾
Replication is the process of duplicating data across multiple storage systems or servers. In HA, replication ensures that a copy of data exists on multiple systems, so if one system fails, another can continue providing access to the same data.
9. Disaster Recovery (DR) 📉📈
Disaster recovery involves strategies to restore a system after a catastrophic failure (e.g., data center failure). DR usually includes off-site backups and failover to remote data centers.
10. Mean Time Between Failures (MTBF) ⏱️
MTBF measures the average time between system failures. A higher MTBF indicates a more reliable system.
11. Mean Time to Repair (MTTR) ⏱️🛠️
MTTR measures how long it takes to restore a system to full functionality after a failure. Minimizing MTTR is critical for reducing downtime in HA systems.
12. Quorum 🐾
Quorum is the minimum number of nodes or components in a distributed system that must agree or function correctly to maintain availability. Quorum is often required in cluster setups to ensure consistent operation.
13. Geographic Redundancy 🌎
Geographic redundancy involves deploying systems across multiple geographical locations or data centers. This ensures that services remain available even if a region experiences a failure (e.g., due to natural disasters or power outages).
Relation to Kubernetes and Warewulf
I wanted to look at Kubernetes and Warewulf and how they relate to this topic as they are both systems written with GO and they are both well liked systems relating to HA.
I will write a future article all about GO and why it is fantastic at a later date. So I will just leave this point for now.
-A language built by the progenitors of UNIX and C for diverse connected systems.
-
Kubernetes 🍀: automated failover container orchestration elastic scaling with Horizontal Pod Autoscalers and geographic redundancy through multi-region clusters.
-
Warewulf 🐺: In HPC environments, Warewulf aids in HA by managing node provisioning and monitoring the health of the compute nodes. In case of failures, Warewulf can quickly re-deploy nodes, ensuring that the overall HPC workload is minimally disrupted.
Kubernetes and Warewulf both play key roles in maintaining high availability in modern infrastructures, with Kubernetes focusing on containerized applications and Warewulf on HPC cluster management.
HA & Incident Triage 🚨
High Availability (HA) systems improve operational security, allowing precise triage due to these factors:
1. Continuous Monitoring
HA systems continuously monitor performance to detect security threats in real time.
2. Continuous Comprehensive Logging
Logs are centralized, providing full visibility across the system for quick forensic analysis.
3. Declarative Structure
Declarative configurations enable automated remediation scripts for rapid self-healing.
4. Automated Alerting
Automated alerts prioritize and notify teams of security incidents as they happen.
Beyond triage, HA systems offer several other security benefits:
5. Containerized Components
Microservices are isolated, allowing affected components to be restarted without system-wide impact.
6. Elastic Scaling
HA systems dynamically scale resources to handle traffic spikes or increased workloads securely.
7. Automated Failover
Automated failover isolates compromised components, ensuring continuous uptime during incidents.
8. Data Replication by Design
Multiple data copies prevent loss and aid in disaster recovery during security breaches.
9. Event Replay
Event replay allows security teams to analyze incidents for better future defense.
Lessons Learned about HA
What I have learned from reading articles, searching and compiling these notes.
The Why
In today’s world, data is ingested, processed, and distributed at an unprecedented rate. To keep up, we must implement systems that operate with the same speed and frequency. The era of handling sequential tasks one at a time is over. High availability solutions such as Kubernetes, declarative infrastructure, cluster management, and stateless automation are now essential in modern IT environments.
Although some developers, administrators, and engineers express concerns about the complexity of these deployments, preferring simpler solutions, the reality is that we need to adapt to the increasing demands of data availability and security. Setting up a robust infrastructure now may have a higher initial labor cost, but it will undoubtedly reduce the risk of costly security incidents and system downtime in the future.
The What
The systems we must focus on include:
- Kubernetes for orchestrating containerized applications across clusters
- Declarative Infrastructure using Infrastructure-as-Code (IaC) for consistent and scalable deployments
- Cluster Management to efficiently manage and scale distributed systems
- Stateless Automation to ensure systems can self-heal and adapt quickly without human intervention
These technologies form the backbone of high availability infrastructures, designed to handle vast amounts of data without compromising performance or uptime.
The How
To implement these solutions, organizations should:
- Automate deployment processes using tools like Terraform or Ansible to ensure repeatability and reliability.
- Leverage Kubernetes clusters to manage microservices architectures, enabling fast scaling and robust fault tolerance.
- Adopt a declarative approach by defining infrastructure states in code, allowing easier management and version control of systems.
- Utilize stateless automation to reduce system reliance on individual components, making the system more resilient to failure and able to recover without manual intervention.
By adopting these practices, companies can build resilient, secure, and scalable infrastructures that meet the demands of today’s fast-paced data environments.
HA and SIR Synergy
The Why
As organizations become increasingly reliant on digital systems, security incidents are inevitable. Data breaches, malware attacks, and system vulnerabilities pose significant risks that can lead to costly downtime, reputational damage, and legal consequences. In this high-availability (HA) era, where uninterrupted service is critical, an effective Security Incident Response (SIR) plan is more important than ever.
The What
At its core, Security Incident Response (SIR) involves:
- Identifying and responding to potential security incidents in real time
- Containing incidents to prevent further damage and preserve critical systems
- Eradicating malicious activity from systems quickly and efficiently
- Recovering compromised systems and restoring operations to normal
- Reviewing and improving security protocols based on lessons learned from incidents
In high-availability environments, this process works hand in hand with:
- Failover mechanisms that redirect traffic or services away from compromised systems to maintain uptime
- Resilient architectures where services are spread across clusters, reducing the impact of a security breach on overall operations
- Automated remediation that helps detect and respond to threats before they cause major disruptions
Together, SIR and HA form a dual-layer defense to keep systems running while actively dealing with security threats.
The How
For Security Incident Response to effectively complement high availability, organizations should:
-
Implement proactive monitoring and detection: Use tools like SIEM (Security Information and Event Management)
-
Prepare for containment and isolation: High availability systems should be designed with segmentation in mind
-
Automate incident response and failover: Automate responses to specific types of threats, such as deploying firewalls, initiating backups, or failing over to standby systems.
-
Maintain constant communication: SIR teams should work closely with HA engineers to ensure that any security measures (e.g., shutting down affected systems) do not inadvertently cause a service disruption.
-
Review and test regularly: Just as HA systems undergo regular testing for failovers, security incident response plans should be tested in simulated scenarios.
Why study failure?
-
Proactive Prevention 🛠️: Identifying potential failure points allows you to take preventive measures and avoid system outages.
-
Faster Recovery 🚑: Knowing how systems can fail enables quicker response and minimizes downtime with a tested failover plan.
-
Resilience Building 🛡️: Understanding failure mechanisms helps design architectures that automatically handle issues, ensuring better uptime.
-
Risk Management ⚖️: Acknowledging failure risks helps balance uptime goals with realistic risk management and avoids catastrophic downtime.
Service Level Objectives (SLOs) 🎯
Intro
Service Level Objectives (SLOs) are specific, measurable targets 📊 that define the expected performance or quality level of a service, typically included in Service Level Agreements (SLAs). They help ensure services meet customer expectations by setting clear benchmarks for key metrics like reliability, availability, and response time.
SLOs help teams prioritize work, manage resources, and drive decisions based on real performance data. 🔧
Check out Google’s guide to SLOs here.
Bad Operations (BadOps) ⚠️
- The unspoken rule of 100% uptime is a myth ❌.
- 100% uptime ≠ 100% reliability.
- Each extra “nine” of uptime comes at a significant cost 💸.
Why Have SLOs? 🤔
- Engineers are scarce 🧑💻: Impossible standards require more resources.
- They inform decisions: The opportunity cost of reliability is clear with an objective.
- SREs aren’t just automation experts; they’re driven by SLOs 🚀.
- SLOs help prioritize tasks effectively 📋.
- They define error budgets to manage acceptable failure rates.
Service Level Indicators (SLIs) 📏
Intro
A Service Level Indicator (SLI) is a specific, quantifiable metric 🔢 used to measure the performance of a service, often forming the foundation of SLOs.
Setting a Solid SLI ⚖️
Two out of five of these factors can be used to form a ratio that serves as a target SLI:
- Number of successful HTTP requests / total HTTP requests (success rate) 🌐.
- Number of gRPC calls completed in under 100ms / total gRPC requests ⏱️.
- Number of search results using the entire data set / total search results, including gracefully degraded ones 🔍.
- Number of stock check requests with data fresher than 10 minutes / total stock check requests 🛒.
- Number of “good user minutes” based on defined criteria / total user minutes 📅.
Glossary of Terms 🙊
These are additional terms I have become familiar with that were not covered in this units notes but relayed by Scott.
Five 9’s
Refers to 99.999% availability, meaning less than 5 minutes of downtime per year.
Single point of failure
A component in a system whose failure will cause the entire system to fail.
Key Performance Indicators
Metrics used to measure the performance and effectiveness of a system or service.
SLI (Service Level Indicator)
A specific, quantifiable metric used to measure the performance of a service (e.g., latency, uptime).
SLO (Service Level Objective)
A target or goal for an SLI, defining acceptable performance for a service.
SLA (Service Level Agreement)
A formal contract that defines the level of service expected between a provider and a customer, including penalties for not meeting SLOs.
Active-Standby
A redundancy setup where one component is active while another remains on standby to take over if the active one fails.
Active-Active
A redundancy setup where multiple components work simultaneously to share the load, and failure in one component is covered by the others.
MTTD (Mean Time to Detect)
The average time it takes to detect a failure or incident in a system.
MTTR (Mean Time to Repair)
The average time it takes to recover from a failure or incident once it has been detected.
MTBF (Mean Time Between Failures) ‘Mentioned Once’
The average time a system operates without failure, used to measure system reliability.
Reflection
- Remaining Qustions?
- How will I put this into practice?
ProLUG Links ⛓️
Discord: https://discord.com/invite/m6VPPD9usw Youtube: https://www.youtube.com/@het_tanis8213 Twitch: https://www.twitch.tv/het_tanis ProLUG Book: https://leanpub.com/theprolugbigbookoflabs KillerCoda: https://killercoda.com/het-tanis